A new interactive digital platform, dreamagainusa.org, has been launched to provide a visceral and challenging experience designed to illustrate the extreme realities of wealth inequality in the United States. Spearheaded by tech luminary Jeff Atwood, co-founder of Stack Overflow, and developed in collaboration with Geoff Dalgas, the website compels users to confront the profound chasm between the nation’s wealthiest and its most impoverished through an arduous scrolling interface. This initiative builds upon the legacy of the widely influential "Wealth Inequality in America" video series, now updated for 2026, aiming to transform abstract economic statistics into a tangible, if uncomfortable, user experience.
The Genesis of a Digital Awakening
The concept for dreamagainusa.org emerged from a deep conviction held by Jeff Atwood, who, like millions, was profoundly impacted by the original "Wealth Inequality in America" video released some 14 years prior. That video, lauded for its ability to visually articulate complex economic disparities, fundamentally reshaped his understanding of societal structures. Recognizing the enduring relevance and escalating nature of wealth concentration, Atwood sought to amplify this message, leveraging modern web technology to create an even more direct and immersive encounter with the data.
"The original video series changed how I thought about the world," Atwood noted, reflecting on the project’s inspiration. "It shows something we feel, but rarely see so clearly — the obscene concentration of wealth and power in this country." This sentiment underscored the development of dreamagainusa.org, conceived not as a mere informational site, but as an experiential tool. The updated 2026 wealth inequality video series, produced by the acclaimed YouTube channel Politizane, serves as a central pillar of this new initiative, providing refreshed data and compelling narrative. Politizane, known for its data-driven explainers, retained full creative control over its contributions, ensuring authenticity and journalistic integrity.
Beyond Politizane, the project also garnered creative input from satirical news giant The Onion and cultural commentary platform Garbage Day. This diverse collaboration underscores a shared commitment to reaching a broad audience through various forms of media, from stark data visualization to sharp social commentary. Atwood emphasized that the collaborative partners maintained complete autonomy over their work, ensuring that the project remained a public-facing endeavor, free from organizational biases. "This is not for me, or any organization. It is for the public. It is for We, The People," he stated, highlighting the initiative’s altruistic intent.

The technical backbone of dreamagainusa.org was meticulously crafted by Geoff Dalgas, a long-time friend and collaborator of Atwood’s, renowned for his instrumental role in building Stack Overflow. Dalgas’s expertise was crucial in translating the ambitious vision of an "endless scroll" into a functional and impactful web application, ensuring that the design elements effectively communicated the intended message of scale and disparity.
An Unconventional User Experience: Suffering as a Feature
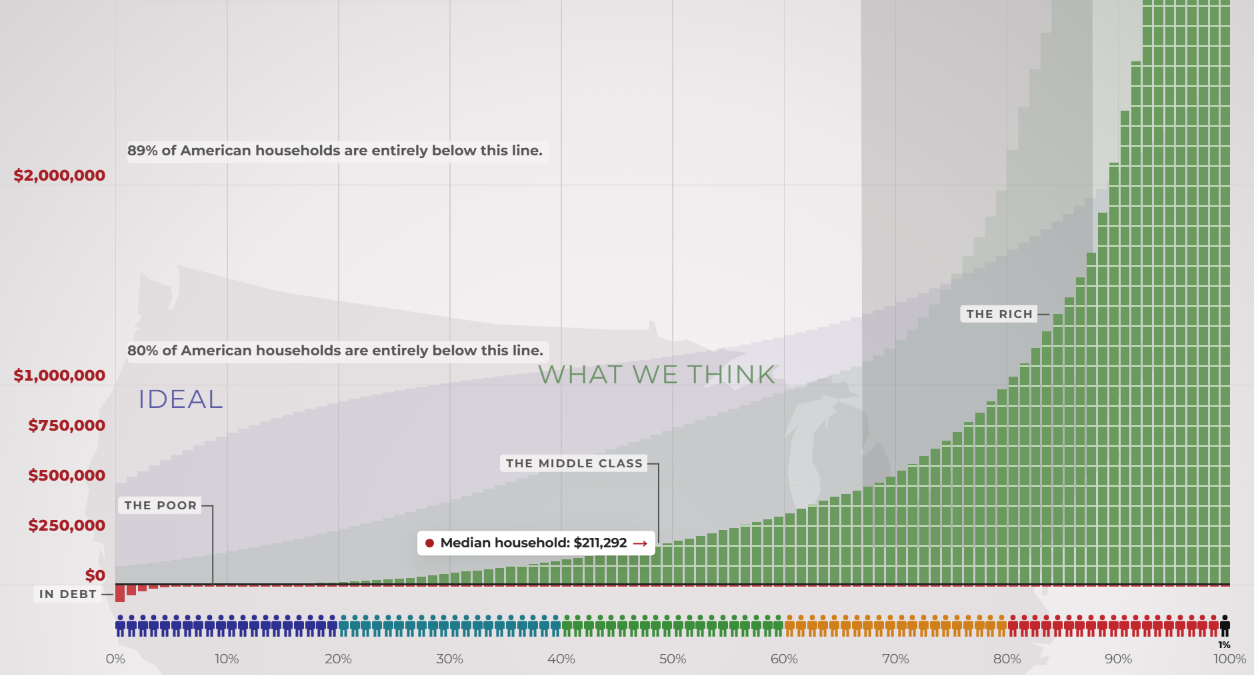
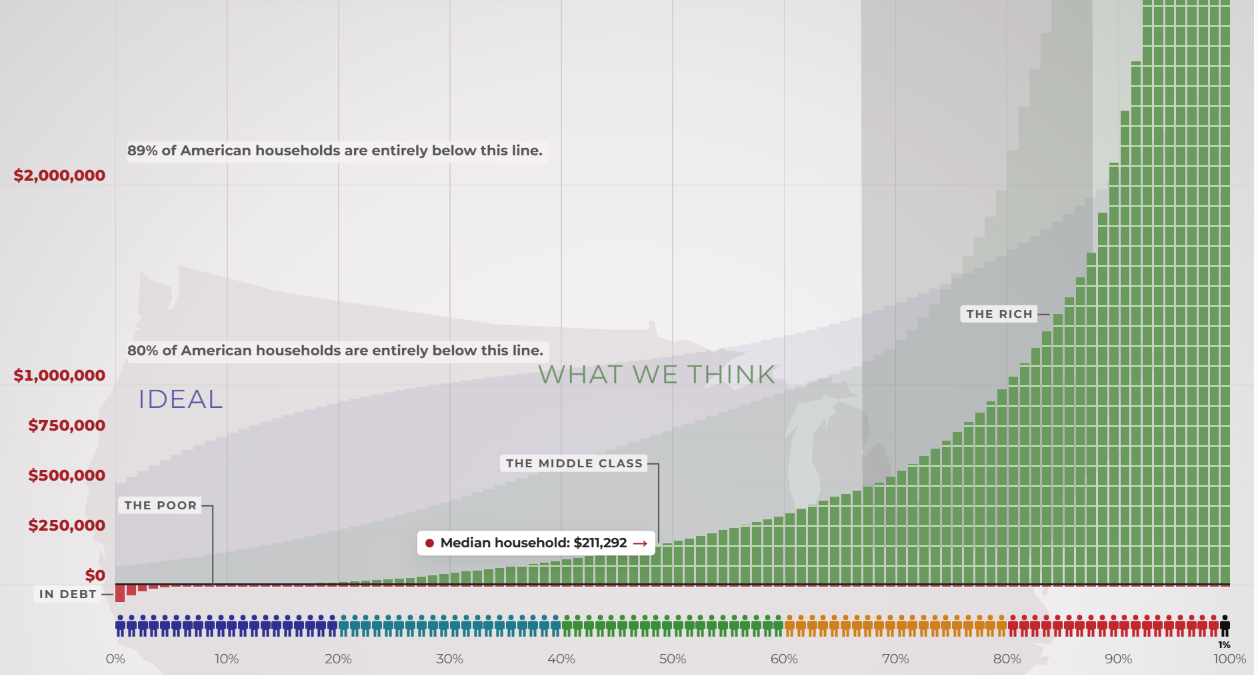
The core of dreamagainusa.org is an interactive graph that visually represents the wealth distribution across the American population. Unlike conventional data visualizations that often compress large datasets into digestible charts, this platform opts for a linear scale, forcing users to manually scroll upwards for an extensive period to traverse the entire spectrum of wealth, from the poorest citizens to the nation’s billionaires. This design choice is deliberate, aiming to convey the sheer magnitude of the disparity in a way that static charts cannot.
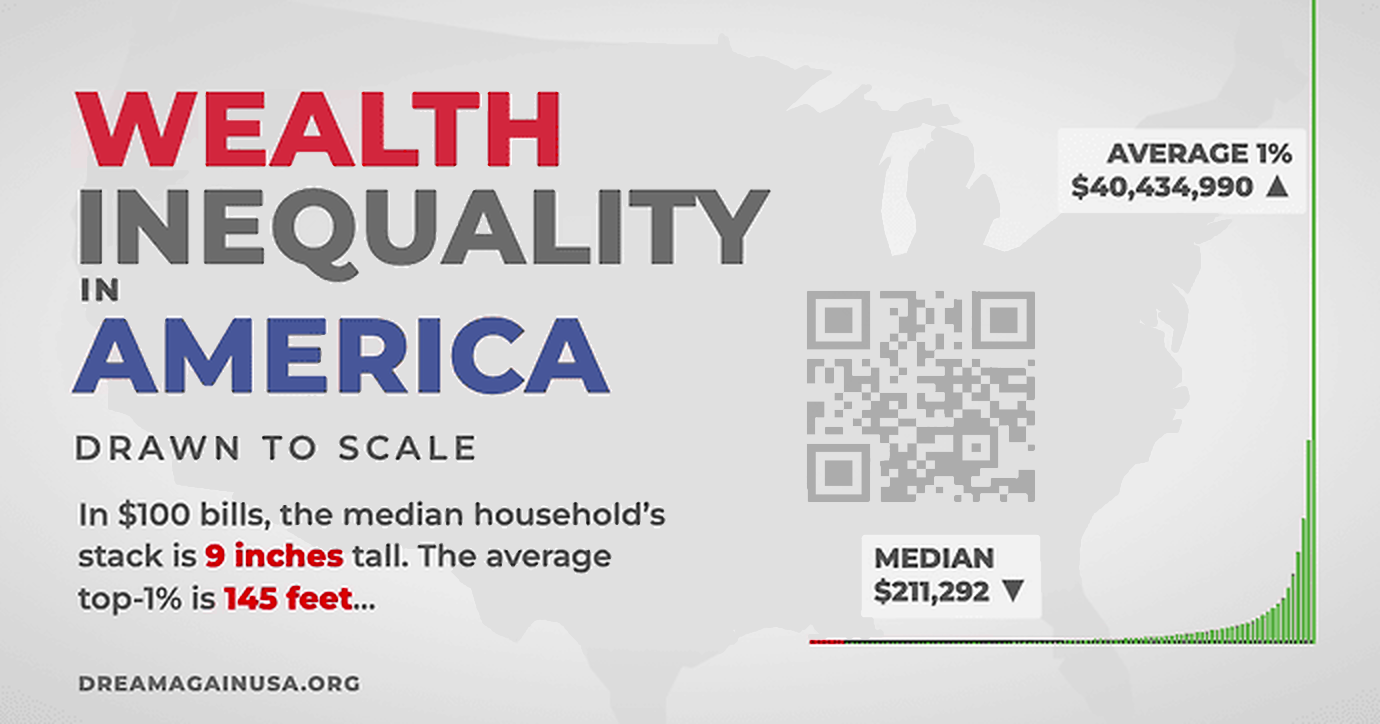
"Wealth inequality on a scale this extreme is almost impossible to explain. You have to experience it to understand," Atwood articulated. The website’s interface is intentionally designed to be inconvenient, a stark departure from typical usability principles. Early iterations explored features like automatic scrolling or rapid jumps, but these were ultimately rejected. The creators insisted that users must physically engage in the act of scrolling, making a conscious effort to climb the vast economic ladder. This manual effort, taking upwards of 12 minutes for a full ascent, is central to the intended impact.
This deliberate "punishment" of the user experience is termed "suffering as a feature" by Atwood. The discomfort and endurance required to navigate the graph are meant to mirror, in a small way, the daily struggles faced by millions of Americans living with minimal resources. While users have the option to click an "I quit" button at any time, this convenience is presented as a stark contrast to the reality for those at the bottom of the economic ladder, who lack an easy exit from their circumstances. "The experience, then, is about endurance in the face of the relentless task of simply living your daily life with almost nothing, surviving as long as you can without reaching for the ‘I Quit’ button," Atwood explained.
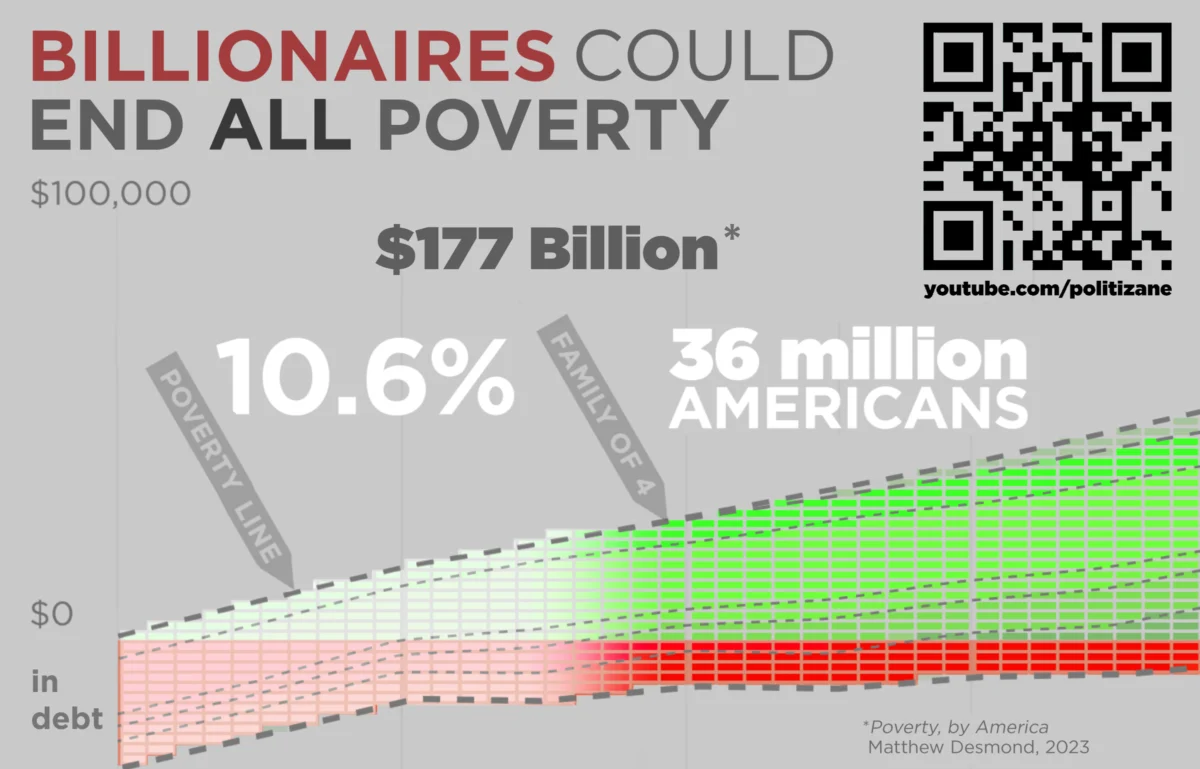
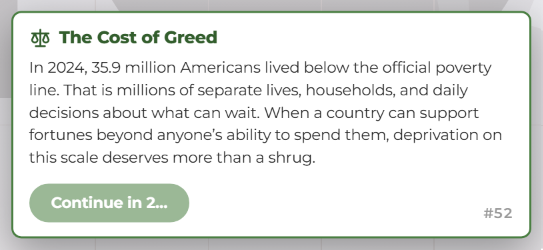
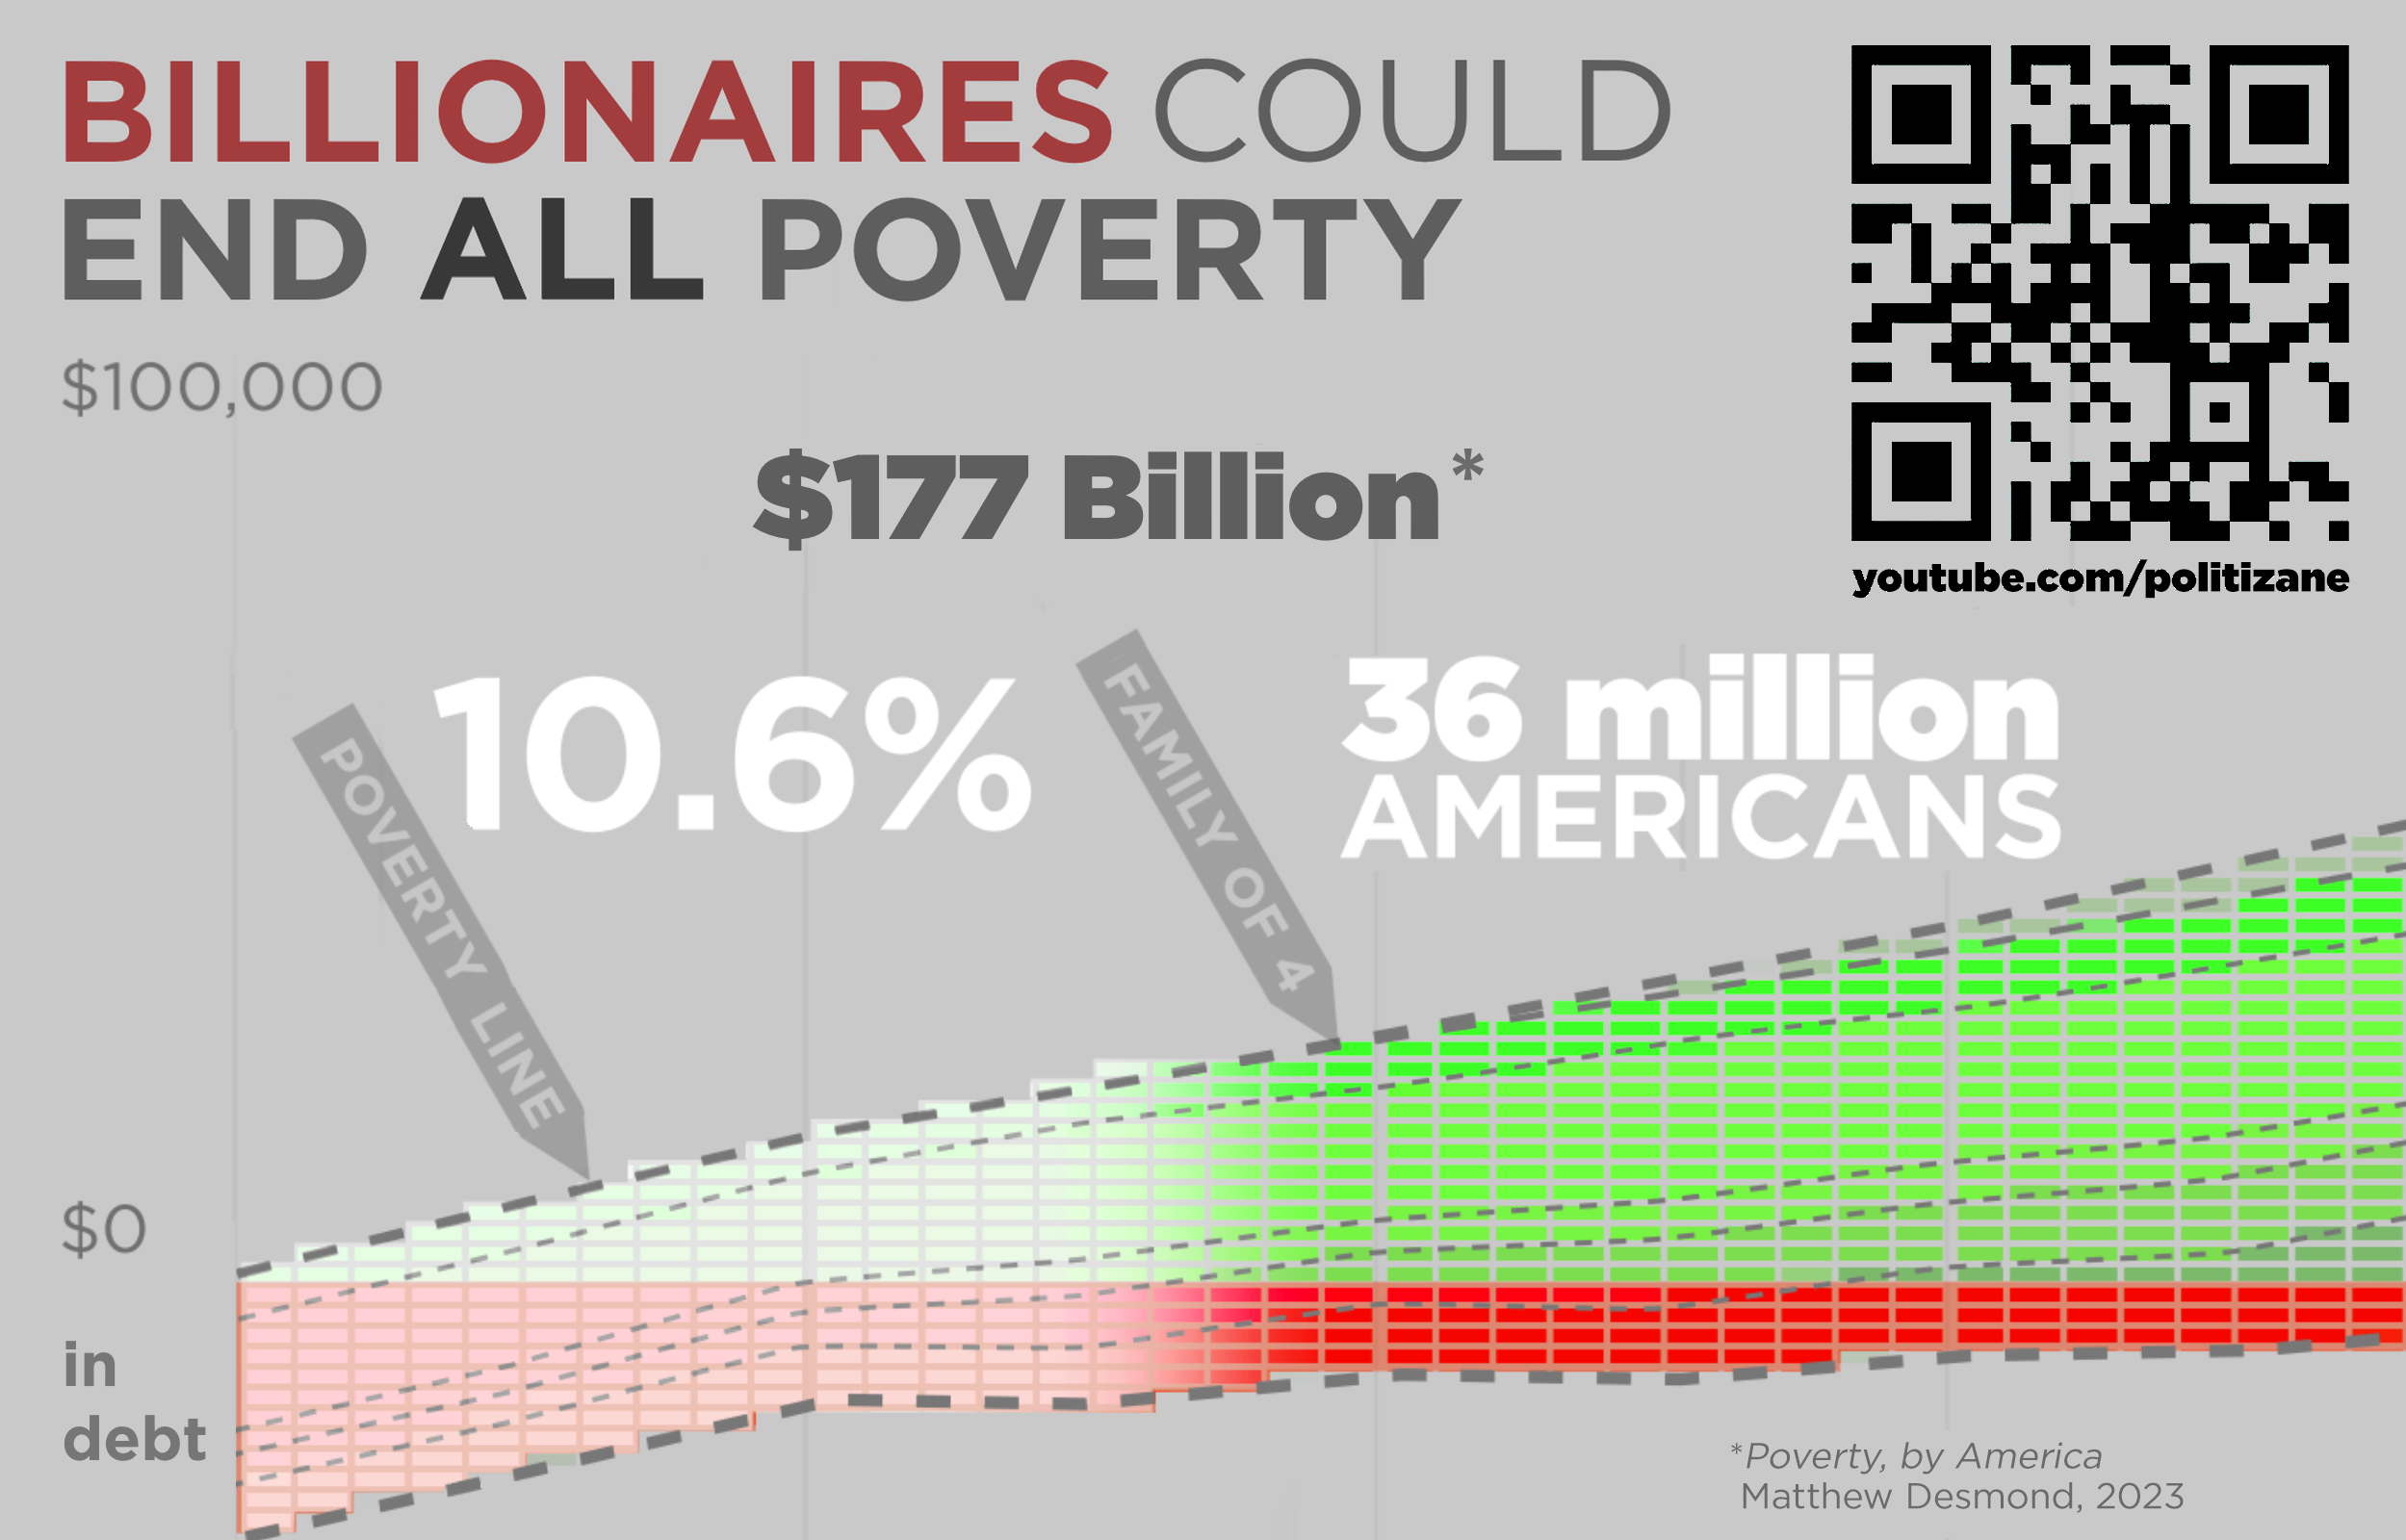
The website also incorporates "forced stops" at critical junctures along the scroll. These interruptions are designed to prevent users from mindlessly scrolling past crucial data points without reflection. One such stop highlights the devastating statistic that 36 million Americans live in poverty. This forced pause is accompanied by the stark revelation that all poverty in the country could theoretically be eliminated for an estimated $177 billion. This figure, often juxtaposed against the aggregated wealth of the nation’s richest individuals, underscores a societal choice to allow such suffering to persist. "We choose to let people suffer in desperate poverty. That’s also suffering as a feature," Atwood remarked, emphasizing the moral dimension of economic policy.
The Stark Reality: Data Behind the Scroll
The dreamagainusa.org platform effectively translates complex economic data into an understandable narrative. The core message is supported by well-documented statistics on wealth distribution in the U.S. As of recent analyses (projected to 2026 in the context of the article), wealth inequality remains a defining feature of the American economic landscape.
For instance, the top 1% of American households consistently hold a disproportionately large share of the nation’s wealth, often exceeding one-third of the total. Conversely, the bottom 50% of households typically possess only a meager fraction, sometimes as little as 2-3% of the total wealth. This extreme concentration is what the scrolling graph vividly illustrates.

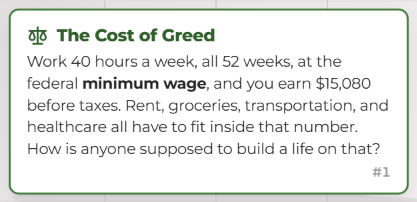
The federal minimum wage, a critical benchmark for many low-income workers, is highlighted on the site. Working 40 hours a week for all 52 weeks at the federal minimum wage of $7.25 per hour (which yields approximately $15,080 annually before taxes), an individual faces immense challenges covering basic living expenses. The site explicitly questions: "Rent, groceries, transportation, and healthcare all have to fit inside that number. How is anyone supposed to build a life on that?" This direct challenge to the user’s perception of economic viability serves to humanize the statistics.
The figure of 36 million Americans living in poverty, a staggering number, is made even more poignant by the revelation that ending this poverty would cost an estimated $177 billion. To put this in perspective, this amount is often cited as a fraction of the annual revenue or market capitalization of some of the world’s largest corporations or the combined wealth of a handful of ultra-rich individuals. This data point underscores a societal prioritization where immense wealth coexists with profound destitution, and where policy choices perpetuate, rather than alleviate, suffering.
Historical Context and Broader Implications
The issue of wealth inequality is not new to the United States, but its trajectory has seen significant shifts over decades. Following World War II, the U.S. experienced a period of relatively stable and even decreasing inequality, largely due to strong labor unions, progressive tax policies, and robust social safety nets. However, beginning in the 1980s, a confluence of factors – including globalization, technological advancements, deregulation, and shifts in tax policy – led to a widening gap between the rich and the poor. This trend accelerated in the early 21st century, exacerbated by financial crises and a subsequent uneven recovery.
The "Wealth Inequality in America" video series, and now dreamagainusa.org, directly addresses this historical context, using updated figures to demonstrate the continuing exacerbation of these trends. The platform serves as a modern extension of public education efforts, utilizing digital interactivity to engage an audience that might otherwise remain disengaged from complex economic reports.
The approach taken by dreamagainusa.org, though unconventional in its user experience design, aligns with a growing movement to make abstract societal problems more tangible. By forcing active participation and creating a sense of "suffering" through the interface, the creators aim to foster a deeper sense of empathy and urgency among users. This method mirrors pedagogical techniques that emphasize experiential learning, where direct engagement can lead to more profound understanding and retention than passive consumption of information.
Economists and sociologists have long debated the causes and consequences of wealth inequality. High levels of inequality are often linked to slower economic growth, reduced social mobility, increased political polarization, and adverse health outcomes. Initiatives like dreamagainusa.org contribute to public discourse by making these academic discussions accessible and relatable, potentially influencing public opinion and, in turn, policy decisions. The platform’s objective is not merely to inform but to provoke reflection and possibly inspire action among "We, The People."
A Call to Action and Profound Reflection
Beyond the interactive website, dreamagainusa.org offers a unique physical artifact: an 8-page foldable version of the graph, designed to be a relatable 6 feet, 6 inches tall – the average height of an NBA player. This printable version allows individuals to bring the immense scale of wealth disparity into their physical environment, serving as a tangible reminder of the data. Described as "the most obscene centerfold of all time," this physical representation aims to shock and inform in a different, yet equally impactful, medium.
The initiative culminates in a powerful challenge to every user: "I challenge everyone to climb the graph on dreamagainusa.org as far as you want to." Following this journey, whether completed or abandoned, the platform poses a singular, profound question: "Was it worth it?" This final query transcends the mere act of scrolling, inviting users to reflect on the societal implications of such extreme wealth concentration. It prompts contemplation on the ethics of a system where immense wealth coexists with widespread poverty, and whether the perceived benefits of such a system justify the human cost.
In an era of unprecedented global wealth, dreamagainusa.org compels its audience to confront uncomfortable truths about economic justice and societal priorities. By transforming abstract data into a personal endurance test, Jeff Atwood, Geoff Dalgas, and their collaborators have created a powerful new tool for civic engagement. The platform represents a significant effort to shift the conversation around wealth inequality from academic debate to a deeply felt, shared experience, aiming to foster greater understanding and potentially inspire collective action towards a more equitable future.
About the Author